Elements of a Realistic Virtual Laboratory Experience in Materials Science:
Development and Evaluation
Javad Hashemi
Texas
Tech University, Department of Mechanical Engineering
Katherine A. Austin
Texas
Tech University, Teaching Learning and Technology Center (TLTC)
Texas
Tech University Department of Psychology
Adam
Majkowski
The
University of Texas Medical Branch, Galveston, TX 77555.
Edward E. Anderson
Texas
Tech University, Department of Mechanical Engineering
Texas
Tech University, Teaching Learning and Technology Center (TLTC)
Naveen Chandrashekar
Texas Tech University, Department of Mechanical
Engineering
Abstract
The development and
evaluation of a realistic virtual materials science laboratory experiment on
metallography is reported in this paper.
This virtual laboratory is highly interactive and has been designed
considering a number of learning styles.
All standard laboratory functions such as stating the objectives of the
experiment, background, procedure, analysis, and establishing conclusions are
performed in a virtual environment. A
novel “decision tree” structure is devised that allows the user to make
decisions from an available menu of options (both correct and incorrect options
are given) and view the results of the decision. The students can view the outcome of an incorrect decision using
the decision tree concept. The
objectives of this tool are to 1) emphasize and verify the learning objectives,
2) prepare the students for an actual in-class laboratory experiment, and 3)
serve as a replacement experience for universities and colleges that do not
have a materials science laboratory. Preliminary evaluation of the software by
students has shown that the software can be effective in achieving the learning
objectives and in serving as a preparation tool for laboratory students.
Introduction
The laboratory
experience represents one of the few hands-on experiences in engineering
education. This experience serves to
reinforce theoretical concepts discussed in engineering courses and provides an
experiential learning process. In order
to have an effective laboratory experience, extensive personnel time must be
used to assure a well organized experience with detailed procedures, and
updated equipment. Often, even after
extensive investment of time and resources by the university, the actual
student experiences in these laboratory courses may not be positive ones. Generally, students express that some of the
deficiencies of a laboratory experience are related to i) lack of familiarity
with the procedure, ii) equipment, iii) measurement tools and methods, and iv)
calculation techniques. Interactive
software could potentially address some of the deficiencies enumerated above
and improve the students learning experience and performance.
With the recent
advances in multimedia technologies, the computer based delivery mode is making
progress and it has become possible to design educational software that teaches
a subject in an interactive fashion (Oblinger and Rush, 1997). Software has the ability to provide
immediate feedback to the user as to the correctness of the approach and/or the
solution. Although computer assisted
instruction (CAI) is seemingly having an impact on undergraduate Science,
Mathematics, Engineering, and Technology education, it has yet to become a
significant force in laboratory instruction.
We suggest that a computer-based tool that allows the student to step
into the experiment, follow a procedure, complete the experiment, collect and analyze
data, and assess his or her findings, allows a student-oriented learning
process to take place that can significantly improve the learning experience as
compared to traditional laboratory techniques.
This tool can decrease the reliance of the students on the instructor
and allow the instructor to contribute in a more meaningful way to the learning
process. Allowing interaction with the
software is critical in order to avoid a purely demonstration experience and
promote self-guided and student-empowered learning (Weller, 2002).
Development of virtual laboratories is not a novel idea. Elsherbeni et al. developed one of the early virtual laboratories in microwave and electronics as purely a visualization tool (Elsherbeni et al., 1995). Some of the earlier efforts in the development of such tools in various engineering fields are those by Chevalier et al. in the mechanics area (Chevalier et al., 2000), Monter-Hernandez et al. in power electronics (Monter-Hernandez et al., 1999), Avouris et al. in computer-assisted laboratory courses (Avouris et al., 2001), and Wyatt et al. in geotechnical topics (Wyatt et al., 1999). Some of the more interactive efforts are those reported by Bhanduri and Shor in the area of Controls (Bhanduri and Shor, 1998), Budhu in Soil Mechanics (Budhu, 2001), and Schmid in Controls (Schmid, 1999). There is a tremendous amount of virtual laboratory software on various subjects available in the literature and on Internet sites. Some subject areas are more adaptable to these approaches such as controls, power, circuits, mathematics, and physics compared to other areas that require more visualization and programming such as equipment-intensive laboratories in which the procedures are crucial and complex.
In the specific area of materials science and engineering, there exists commercially available software that serves to enhance the learning experience of the students in this area (Callister, 2000). The software is an excellent concept visualization and enhancement tool, but it is not a virtual laboratory. Another effort in the direction of multi-media virtual laboratories in the area of Mechanics and Materials science was recently reported (Khanna et al., 2002). The authors have developed, as part of an integrated mechanics and materials course, a virtual laboratory module on tensile testing which is an important concept and experience in all engineering programs. The software is interactive, allows for student participation, and is designed based on learning theories proposed by Russ on motivation to learn through software presentation (Russ, 1976).
In this paper, we present the development process and the necessary elements of an interactive virtual materials science laboratory module. The novelty of the approach is in its focus on laboratory procedures as a preparation tool for an actual experiment in materials science. New features are incorporated into the software that allow the student to make decisions, observe the results of the decision (both correct and incorrect outcomes are provided), and find the correct path through a trial and error process, as is the case in an actual laboratory environment. The software is designed based on conventional and more recent learning theories and it also accommodates various learning styles. This software can serve as a preparation tool for an existing materials science laboratory course or as a replacement tool in organizations where a materials science laboratory experience does not exist.
Method
The development
approach takes advantage of the existing software technology (Macromedia’s
Authorware and Flash), multimedia technology (digital video, still photography,
sound), and a logical and structured approach to the presentation of materials
(Hashemi. et al., 2002). A flow chart, developed as a blue print of steps taken
in the experiment, is used to emphasize important concepts in the experiment,
identify junctions that require visual or audio reinforcements, identify
potential crossroads, and determine what needs to be measured, calculated, and
reported. The authors also carefully
constructed menu options to maximize the intuitive flow of the interface for
the student (Howes & Payne, 1990).
As with the design and
preparation of any educational tool, the design of educational software must consider
both conventional and modern learning theories. For example, according to conventional theories, subjects learn
through cognitive and experiential means, (Rogers, 1969). Rogers states that
experiential learning can be applied to the solution of one or more specific
problems (for instance what engineers learn) and is important for long term
retention and deeper learning. To
achieve experiential learning, the teacher, or in our case the software, must
accommodate the learner’s involvement and self-evaluation, without dominating
the process. More modern
theories specifically related to software design state that learning should be
designed around a situation or an “anchor” using a case study or a problem
situation (Bansford et al., 1990), i.e. “Anchored Instruction”. Interactive
multimedia tools can easily achieve this but should allow for exploration by
the user. Perhaps the strongest
influence in the design of the structure of this software has been the conditions
of learning proposed by Gagne (Gagne, 1985; Gagne, 1992). Gagne suggests that,
when designing instruction, various instructional events must be accommodated
for learning to occur. These include gaining attention, presenting the
objectives, requiring recall of learned subjects, presenting stimulus,
guidance, feedback, requiring performance, assessing performance, and enhancing
retention.
In addition to the
importance of learning theories, in designing software, one must consider that
styles of learning also play an important role in education and teaching
(McCarthy, 1987). While the empirical
evidence for the predictive validity of student learning style in terms of
academic performance is convoluted, Sternberg and Grigorenko (2001) indicate
that clearly learning preferences do exist and impact student motivation and
satisfaction in a learning environment.
As an example, McCarthy asserts that there are four different learning
styles: innovative (need reason for learning – why do I need this?), analytic
(want to deepen their understanding – learn effectively from lectures), common
sense (want to know how things work – learn it and try it), and dynamic (want
to learn on their own – independent learners).
Regardless of the particular learning styles instrument or theoretical
approach you select, effective pedagogy must consider the learning style of the
audience, and the learning tool must address and attempt to accommodate a
variety of learner preferences.
Instructional materials that present material in multiple modalities are
more likely to engage and maintain student attention (Mayer, 2002). Materials that are designed with learner
preferences and limitations are more likely to create an environment conducive
for learning (Dillion & Gabbard, 1998).
The virtual
experiment presented here is based on a “Metallography” experiment, which is
performed in any materials science laboratory course. Metallography is the process of preparing and analyzing the
internal microstructure of metallic specimens through optical techniques. The experiment requires up-dated equipment
and facilities such as grinding wheels, polishing wheels, specimen mounting
kits, and a metallograph (a metallurgical microscope). The following is a synopsis of the
important elements used in the development of the software.
Objective of the experiment: In our metallography module, the student
is given an initial brief introduction as to the objectives of the experiment
i.e. what is metallography and what it is used for. For example, the metallography is used for inspecting failed
components to determine where, why, and how this failure occurred. The authors consider this as the anchor of
the experience. This positively
influences the innovative learners who need extrinsic and application-oriented
reasons for learning.
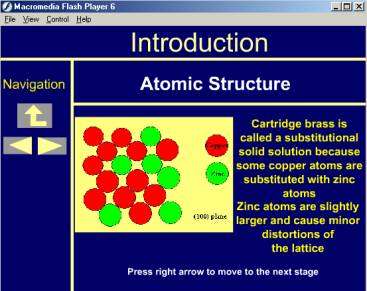
Brief introduction of the metal: The students can then choose from a menu
of metal choices and begin the experiment.
For every chosen metal, a brief background is given describing the
structure, important features, and applications of the metal, Figure 1. Once the short introduction stage is
completed, the experimental procedure begins.
Procedure: The procedure is presented in a step-by-step
methodical fashion. Where needed, a
video-clip of the actual process such as specimen mounting, releasing,
grinding, polishing, and etching are given.
For instance, the user selects the
first stage of the process, which is specimen mounting and preparation. Here, the student is shown a short, but
detailed, clip of a metal sample being mounted, and the sample being
prepared. The stages that follow including
sample grinding (makes the surface uniform), polishing, Figure 2, (makes the
surface smooth), and etching, (the surface is exposed to a chemical), are
presented in the same manner with a reasonable degree of detail.
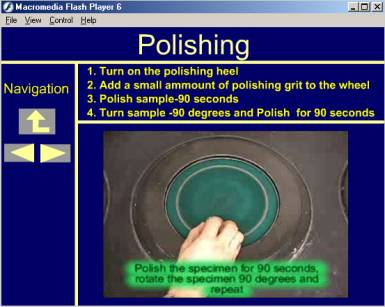
Figure 2. The
virtual lab showing various preparation stages of the sample.(click the figure caption to view the polishing stage)
Analytic and common
sense learners who want to deepen their understanding and learn how things work
are targeted in this section. For
example, the progressive improvement in the surface of the metal after the
completion of the grinding and polishing processes is verified by providing
high and low magnification images of the surface, Figure 3. This is practically impossible to do in an
actual laboratory environment.
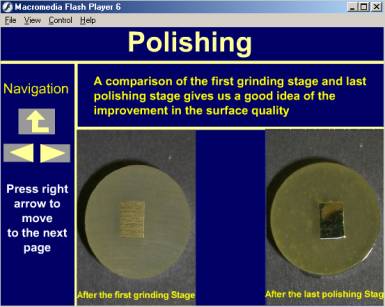
Figure 3. Images showing the surface quality after the
polishing process.(click the figure caption to view
the improvement in the quality of the surface)
Decision Tree: A “decision tree” structure that allows the student
to make a decision from a menu of options about a certain step in the
experiment is incorporated into the software (Hashemi et al., 2003). The purpose of this feature is to engage the
dynamic independent learner. Consider
the etching process: one major element of the etching process is the selection
of the time period that the surface must be exposed to the chemical of
choice. This time generally varies from
sample to sample and the students, in an actual laboratory experience, go
through a trial and error process to find the most effective etching time. In doing so, they find out what happens if
they use an excessive or an insufficient period of etching time. The same process is integrated in the
software as a decision tree, Figure 4.
The decision tree asks about the proper etching time for a brass sample
and four options are given ranging from ten to ninety seconds. Clearly, the student may not have any idea
about the proper etching time but they can guess and go through a trial and
error process. For example, if the user
selects ninety seconds (an incorrect answer) as the proper etching time, a
photomicrograph of the sample will be shown at a specific magnification after
ninety seconds of exposure time. On the
same page, the student is asked if the surface is properly etched (two options
are given: yes or no). If the user
responds “yes”, the software prompts the user with an incorrect decision and
also explains why the given etching time is incorrect. In this case the user is given an
explanation that the exposure time is too long and therefore the features are
overwhelmed by the extensive chemical reaction and the sample is
“over-etched”. At this point the user
is prompted to try again and choose another etching time. If the user selects, for example, ten
seconds as the etching time (an incorrect answer), the same exact process is
repeated and the user learns what happens to a sample if it is exposed to an
etchant for short periods of time, i.e. the sample is “under-etched”. The process is repeated until the student
makes the correct decision and selects a proper etching time. In going through this process, the user
makes decisions, observes the results of his or her decisions, and learns
important concepts with both correct and incorrect answers. This aspect of the
software illustrates and promotes an experiential learning process.
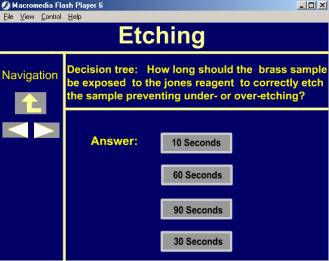
Figure 4. The “decision tree” structure
(click the figure caption to view the decision tree exercise)
After the etching
stage is completed, students can observe the microstruture at various
magnifications as presented by the software, Figure 5. Important information is given about various
features that they observe in each photomicrograph. This is done through the simulation feature of the virtual
laboratory. Various microstructural
features are observed and presented at a specific magnification using a digital
video simulation.
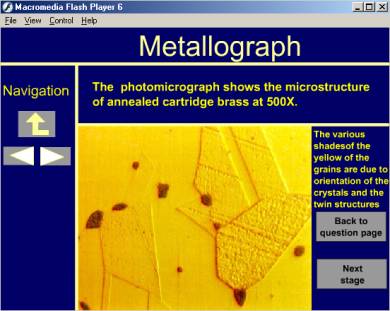
Figure 5. Examining the microstructure at higher
magnifications and identifying the microconstituents.(click the figure caption to view the microstructure)
Measurements and Calculations: After
basic observations of the microstructural features, the students are presented
with a step-by-step procedure of calculating the ASTM grain size number for the
metal. For example in determining the
ASTM grain size of a brass sample, Figure 6, the students are first presented
with the procedure of determining the grain size which includes: taking a
photomicrograph at a specific magnification, counting the grains on the boundary
of the photomicrograph (counted as half grains), counting the grains on the
inside of the micrograph (full grains), modifying the counted total grains for
the magnification of interest, and finally the determination of the grain size
number. All steps are presented through
digital simulation clips allowing a dynamic process of learning and
visualization.
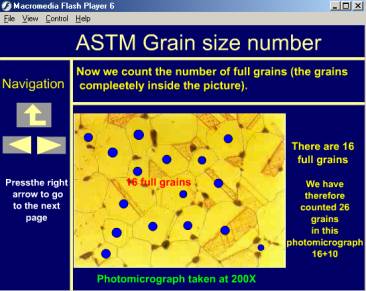
Figure 6. The
ASTM grain size determination. (click the figure
caption to view the grain size determination exercise)
A similar process
is developed for the calculation of average grain diameter. Each step in the process is explained in
detail and the students are guided through the important details of making
measurements and performing calculations.
The student will then be directed to the metal menu page to select
another metal.
Requiring “recall”: In going through the microstrutural analysis of the
second metal, the previous grinding, polishing, and etching information is not
repeated. Instead the students are asked
questions that tests and verifies knowledge gained during the previous
round. For example, when discussing
grinding, the students are asked questions, Figure 7: How many stages of
grinding are necessary? What is the progression of the grit size during
grinding operation? What is the average
grain diameter of the sample shown? These issues were discussed in detail
during analysis of the first metal, and here instead of repeating them, we
require “recall” to assure that the student has learned the topic. The students are not given any help or
explanation in this stage but with every wrong answer a helpful hint is given
to direct them to the correct answer.
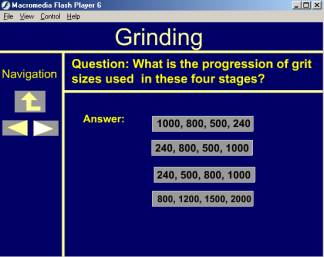
Figure 7.
Questions requiring recall.(Click the figure
caption to view the questions)
Software
Evaluation
The developed software was evaluated in two forms: 1)
an evaluation was performed to determine if the software can achieve its
learning objectives in a standard lecture course. 2) A usability study was
performed to determine if the students enrolled in the actual laboratory course
would find the presentation and the contents of the software beneficial to
their performance, learning, and understanding in the laboratory course.
Non-laboratory students: The developed module was evaluated by two
groups of advanced undergraduate students (58 junior level students) that had
not taken the materials laboratory course and had no knowledge of the procedure
and objectives of the virtual experiment.
These students were enrolled in Mechanics of Solids and Materials
Science courses. The students in the
materials science class had exposure to some of the learning objectives
presented in the software. Access to
the software was provided to the students through the Internet. The students were asked to review the
virtual experiment and at the conclusion of the experiment they were asked to
take a quiz consisting of twenty-two questions. The questions were designed to test student understanding of the
experiment objectives (2 questions), learning objectives (11 questions),
procedure (7 questions), and calculations (2 questions). The performance average of the students who
took the quiz was calculated to be 80.1 with a standard deviation of 9.7.
Approximately,
three weeks after the students were exposed to the virtual laboratory, the
students were asked to evaluate the software in various areas including ease of
navigation, flexibility, screen elements, feedback elements, and the overall
learning experience, Table 1. The range
of the response for each statement or question was set from “1” (very negative)
to “9” (very positive). The first group
of questions (Q # 1-6) were given to determine the level of student
sophistication and involvement with Internet, software, and other computer
experiences. The responses show that
this group of students had extensive experience with spreadsheet (m = 5.43) and in general software use (m = 6.25).
The second group of questions (Q # 7-12) related to general reaction to
the overall experience. The purpose
here was to assess the student attitude toward this specific software as far as
the overall experience, ease of use, flexibility in navigation, and learning
objectives. The response was not overly
enthusiastic but was not disappointing either.
In general the students found the experience to be a positive one,
relatively easy and flexible, and the most important issue was that they
believed that they learned from the software (m = 6.29). The
results here hint at the fact that there is resistance on the part of students
toward using software as a learning tool.
We also asked questions about the screen elements and the general layout
of the software (Q # 13-16). The
results were very encouraging and the students revealed very positive view of
the way the software was designed with the use of icons (m = 6.91), characters (m = 6.82), imagery (m = 6.81), and layout (m=6.46). The
navigation through the software was also evaluated (Q # 17-23) and this also
showed very positive student view of the software. The impromptu quizzes spread throughout the module were very
popular (m = 6.82).
The quizzes add more interactivity to the software and the students like
that. In determining which aspects of
the module were really helpful to the students, instant feed back (m = 6.4), movie clips (m = 6.1), and text materials (m = 6.6) all showed strong influence. Questions were asked to determine if such
software would be helpful as a learning tool to accompany lecture or a
laboratory course (Q # 24-26). The
responses were very positive in this category of questions showing that the
software was helpful (m = 6.76),
helped them understand the objectives (m = 7.01), and helped them learn (m = 6.5).
Table 1. Descriptive
Statistics
|
Q# |
Category |
Number of Responses |
Mean |
Std. Deviation |
|
|
Computer Experience |
|||
|
1 |
Word Processing |
58 |
6.2586 |
2.22868 |
|
2 |
Spreadsheet |
58 |
5.431 |
2.42148 |
|
3 |
Database |
57 |
3.1579 |
2.16126 |
|
4 |
Graphic Program |
58 |
4.5517 |
2.33338 |
|
5 |
HTML Editor |
58 |
2.1034 |
1.92572 |
|
6 |
Games |
58 |
5.8793 |
2.78516 |
|
|
Reaction to the Virtual
Laboratory Experience |
|||
|
7 |
Wonderful |
58 |
5.9138 |
1.64674 |
|
8 |
Satisfying |
58 |
5.5345 |
1.5584 |
|
9 |
Stimulating |
58 |
4.9138 |
1.91288 |
|
10 |
Easy |
58 |
5.9655 |
1.54427 |
|
11 |
Flexible |
58 |
5.2759 |
1.38657 |
|
12 |
Learned |
58 |
6.2931 |
1.55607 |
|
|
Screen Elements |
|||
|
13 |
Characters |
58 |
6.8276 |
1.5118 |
|
14 |
Icons |
58 |
6.9138 |
1.36734 |
|
15 |
Layout |
58 |
6.4655 |
1.41688 |
|
16 |
Slides |
58 |
6.8103 |
1.43217 |
|
|
Ease of Navigation |
|||
|
17 |
Navigation |
58 |
6.5345 |
1.72917 |
|
18 |
Movies |
58 |
6.4483 |
1.63484 |
|
19 |
quizzes |
58 |
6.8276 |
1.82707 |
|
20 |
Move Lab |
58 |
6.569 |
1.79778 |
|
|
Module Helpfulness |
|||
|
21 |
Feedback |
58 |
6.431 |
1.78799 |
|
22 |
Movie Clips |
58 |
6.1034 |
1.96183 |
|
23 |
Text |
58 |
6.6552 |
1.34493 |
|
|
Course Module Design |
|||
|
24 |
Helpful |
56 |
6.7679 |
1.12801 |
|
25 |
Help Understand |
56 |
7.0179 |
1.21343 |
|
26 |
Helped learn |
56 |
6.5714 |
1.3329 |
Laboratory students: The authors
conducted usability studies on the virtual experiment on metallography.
Schneiderman (1997) indicates that a critical cog in usability testing is
generating an end user survey to complete after the interface task. Another key element of user-directed
interface design is involving the target users in evaluating the interface
(Galitz, 1997). As such, students enrolled
in the Materials Science Laboratory reviewed the software either prior to the
actual lab experiment (19 students) or after completing the actual lab
experiment (14 students). Each student
completed a survey based on five general areas of evaluation: overall impression (6 questions); screen
elements (4 questions); navigational structure (4 questions); course module
features (3 questions); and learning experience (4 questions). Each question contained a likert scale
ranging from 1 (negative evaluation) to 9 (positive evaluation). In terms of the overall impression, students
were asked to evaluate the electronic lab using following attributes: terrible-wonderful; frustrating-satisfying;
dull-stimulating; difficult-easy; rigid-flexible; and learning nothing-learned
new things. Figure 8 depicts the
favorable means in each attribute category for the pre-exposure and
post-exposure groups:
Figure
8. Overall Impressions Pre and Post Lab
Exposure
The second evaluation area measured student
satisfaction with the various screen elements.
Sanders and McCormick (1993) highlight the necessity of careful display
design to include careful attention to icons and images, characters, screen
organization, and adequate space.
Figure 9 depicts the favorable mean evaluation of screen elements for
the pre-lab exposed and post-lab exposed groups:
Figure
9. Screen Element Evaluation
A third evaluation area examines the organization and
navigation of the electronic learning materials. Materials that are poorly organized and not strategically ordered
can increase the amount of cognitive load for the student (Wright, Fields &
Harrison 2000; Sutcliffe, Ryan, Doubleday, & Springett 2000). Figure 10 illustrates the favorable mean
ratings for the navigation structure in terms of the general interface, after
the movie clips, mini-quizzes, and between labs:
Figure
10. Organization and Navigation
Structure
A fourth evaluation area involves the
elemental course module features.
Consistency among and within these features is critical to the success
of any learning interface (Ozok & Salvendy, 2000). The survey instrument focused on three
module elements that the author deemed most illustrative of the learning goals
embedded in the software design.
Feedback from the mini-quizzes provided students with immediate and
evaluative information concerning their performance in the module. Secondly, movie clips helped to visually
demonstrate the lab processes as illustrated above. These visual descriptions are typically rated highly by students
using electronic course materials (Mayer & Anderson, 1992). A third course feature included the textual
materials. Unlike a traditional
classroom lecture or lab demonstration, students can explore through the
information at their own pace and at their own speed. The authors wanted to evaluate the usefulness of the text
material. Figure 11 suggests that
students in both the pre and post exposure groups rated each element as
valuable and positive:
Figure
11. Course Module Features
In terms of the overall software experience, students
in both groups indicated that the electronic labs enhanced/would have enhanced
the learning process. Figure 12
illustrates this student feedback.
Figure
12. Overall Experience
The
usability study yielded two primary discussion points and paved the way for the
next step in examining the efficacy of virtual lab instruction. Pre-exposure and post-exposure student
responses yielded highly favorable impressions of the module organization,
design, and effectiveness. As such, the
authors found no major flaws in the design or presentation of lab materials and
can conclude that the module design did not increase cognitive load and
prohibit learning (Niederhauser, Reynolds, Salmen, & Skolmoski, 2000). As the authors analyzed the quantitative and
qualitative responses, we noted that students in the post-exposure lab reported
a better understanding of the material.
Hence, students that completed both the traditional lab and then the
virtual lab reported a better understanding than those students that had just
been exposed to the virtual lab when they responded. One simple explanation is that simple repeated exposure improves
retention and recall, but another possibility is that the virtual laboratory supports declarative learning and the classroom
exposure may support and encourage more procedural learning (Glaser &
Bassok, 1989).
Conclusions
The developed
software has shown the potential to help the student in learning materials
science concepts and procedures for laboratory experiments. The concept of a decision tree can enhance
the student’s experience with the software and bring it a step closer to the
actual laboratory experience. More
significant decision tree experiences can be designed for other experiments
such as tensile testing of materials, heat treating of metals, hardness
testing, and other similar experiments.
The student quiz results taken immediately after they viewed the virtual
experiment showed that the learning objectives were met and that the software
can be effective as a learning enhancement and textbook supplement tool. The general evaluation of the software,
performed some time after the date of the quiz, showed that the students, in
general, believe that the software was helpful and met the stated
objectives. The evaluation results and
the overall process also showed that the non-laboratory students are not very
enthusiastic about working with a software and they resist such tools. However, if the software is required to be
used as part of a course such as a laboratory course, this problem may be
solved.
Additionally, the
fully developed software can be used as a preparation tool for those
engineering programs that offer a materials laboratory. The students can use the software to become
familiar with the procedure, with the use of equipment, and with the pitfalls
that they may encounter during the course of an actual experience. In those situations where a laboratory
experience may not be available, such as at small universities and colleges in
developing countries, the software can serve as a replacement experience. Advanced high school and junior college
students can use this software to educate themselves about the activities that
engineers undertake. Finally, the
software can be used to train new teachers on this topic and help them devise
similar structures in their laboratory practices.
As we progress
through the digital age, educators must take care to ensure that pedagogy
drives the development of technology tools and not visa versa. As universities experience declining budgets
and increased demand for all resources, technology may provide some
efficiencies and economies. However,
these technology tools should be student-centered and pedagogically based. In the present development project and
usability study, the authors found that a virtual lab environment warrants full
development and merits further empirical investigation. Our initial findings support the completion
of software development and the implementation of formal learning assessment.
Acknowledgement
The support of Teaching , Learning, and Technology
Center (TLTC) is gratefully acknowledged.
Also, two of the authors (JH and EEA) gratefully acknowledge the partial support by the
National Science Foundation's Course, Curriculum, and Laboratory Improvement
Program under grant DUE-0231406. Work
under this grant is on-going.
References
1.
Avouris, N. M., Tselios, N., and Tatakis, E. C.,. Development and Evaluation of
a Computer-Based Laboratory Teaching Tool, Computer Applications in
Engineering Education, 9(1) (2001).
2. Bansford, J.D. et al.. Anchored Instruction: Why We Need It and Hhow Technology Can Help, Cognition, Education and Multimedia. Hillsdale, NJ, Erlbaum Associates (1990).
3. Bhandari, A. and Shor, M., Access to an Instructional Control Laboratory Experiment through the World Wide Web. Proceedings of the American Control Conference, Philadelphia, PA (1998).
4. Budhu M., Enhancing Instructions Using Interactive Multimedia Simulations. Simulation, 76:4, 222-231, (2001).
5. Callister, W.D., Materials Science and Engineering an Introduction, Fifth Edition, Wiley Publishing Company, New York, New York. (IMSE: Interactive Materials Science and Engineering, IntelliPro, Inc.) (2000).
6.
Chevalier, C. R., Craddock, J. N., Riley, P. C., and Trunk, B. J., Interactive
Multimedia Labware of Strength of Materials Lab. Computer Applications in Engineering Education, 8(6)
(2000).
7. Dillon, A. & Gabbard, R., Hypermedia as an educational technology: A review of the quantitative research literature on learner comprehension, control, and style. Review of Educational Research, 68, 322-349 (1998).
8.
Elsherbeni, A., Tew, M., and Mokaddam, A., Applying Multimedia Technology to
Undergraduate Engineering Laboratories.
Computer Applications in Engineering Education, 3 (1995).
9. Gagne, R., The Conditions of Learning, Fourth Ed., New York: Holt and, Rinehart & Winston (1985).
10.
Gailitz, W.O., The Essential Guide
to User Interface Design: An
Introduction to GUI Design Principles and Techniques. New York:
Wiley Computer Publications (1997).
11.
Glaser, R. & Bassok, M., Learning
theory and the study of instruction. Annual
Review of Psychology, 40, 631-666 (1989).
12. Hashemi, J., Anderson, E. E., Majkowski, A., and Stalcup, K.A., The Laboratory Experience: Need for Alternative Delivery Methods. Proceedings of the University Synergy Program Conference, Lubbock, TX (2002).
13. Hashemi, J., Stalcup, K.A., Anderson, E. E., and Majkowski, A., Development of Software to Improve Learning and Laboratory Experience in Materials Science. Proceedings of the ASEE Conference, Nashville, TN (2003).
14. Howes, A. & Payne, S.J., Display-based competence: Towards user models for menu-driven interfaces. International Journal of Man-Machine Studies, 33, 637-655 (1990).
15. Khanna, S.K., Jenkins, C.H., and Roylance, D., A new Approach to Integrated Instruction in Mechanics and Materials Science. Proc. Instn. Mech. Engrs. Vol. 216 Part L: J Materials: Design and Applications (2002).
16. Mayer, R.E., Multimedia Learning. In D.L. Medin (Ed.) The Psychology of Learning and Motivation (pp. 85-139). San Diego, CA: Academic Press (2002).
17. McCarthy, B., 4MAT in action: Creative Lesson Plans for Teaching to learning styles with Right/Left Mode Techniques. Wauconda, IL: About Learning, Inc. (1987).
18.
Montero-Hernandez, O., Rugerio De La Rosa, A., Baez-Lopez, D., Alejos, R.,
Power Lab: a Tool to Learn Electrical Machines and Power Electronics. Computer
Applications in Engineering Education, 7(3) (1999).
19. Niederhauser, D.S., Reynolds, R.E., Salmen, D.J., & Skolmoski, P., The influence of cognitive load on learning from hypertext. J. Educational Computing Research, 23(3), 237-255 (2000).
20.
Oblinger, D. G. and Rush, S. C., Challenges
of the Learning Revolution,
Bolton, MA: Anker Publishing
Company (1997).
21.
Ozok, A.A., & Salvendy, G.,
Measuring consistency of web page design and its effects on performance
and satisfaction. Ergonomics, 43(4),
443-460 (2000).
22. Rogers C.R., Freedom to Learn, Columbos, OH: Merril (1969).
23. Russ, R., Creative training Styles: Finding the right Fit,
Training and Devel., 48, (6) 46 (1978).
.
24. Sanders, M. and McCormick, E., Human Factors in Engineering and Design
(Seventh Edition, pp. 91-131) New
York: McGraw-Hill (1993).
25. Sternberg, R.J., & Grigorenko, E.L., A capsule history of
theory and research on styles. In R.J.
Sternberg & L.F. Zhang (Eds)., Perspectives on Thinking, Learning, and
Cognitive Styles (pp.1-21). Mahwah,
N.J.: Erlbaum (2001).
26.
Schmid, C., A Remote Laboratory Using
Virtual Reality on the Web. Simulation
73:1, 13-21 (1999).
27. Schneiderman, B., Designing the User Interface:
Strategies for Effective Human Computer Instruction. New York:
Harcourt-Brace (1997).
28.
Sutcliffe, A.G., Ryan, M., Doubleday, A., & Springett, M., Model mismatch analysis: Towards a deeper explanation of users’
usability problems. Behavior &
Information Technology, 19(1), 43-55 (2000).
29.
Weller, M., Assessment issues on a
web-based course. Assessment &
Evaluation in Higher Education, 27(2), 109-116 (2002).
30. Wyat T.R., Arduino, P., and Macari, E. J., Assessment of a Virtual Laboratory for Geotechnical Engineering, ASEE/IEEE Frontiers in Education Conference (1999).