DESIGN
AND DEVELOPMENT
OF AN
INTERACTIVE WEB-BASED
ENVIRONMENT FOR
MEASUREMENT OF
HARDNESS IN
METALS: A DISTANCE
LEARNING TOOL
J. Hashemi, N. Chandrashekar, and E.E. Anderson
Texas
Tech
University
Department
of Mechanical Engineering
Summary
An interactive
web-based experiment on measurement of hardness of metals was designed as a
preparation tool for students in the Materials and Mechanics Laboratory course
at
Texas
Tech
University
. This web based experiment gives the student an introduction to the concept of
hardness, what it means, how it is measured, and the calibration and utilization
procedure using a Rockwell tester. An interactive decision tree structure is
used to train students to choose the right hardness scale to be used to measure
the hardness. This interactive ‘virtual laboratory’ was found to improve the
understanding and performance of the students in the laboratory.
Abstract
An interactive
web-based experiment was designed as a preparation tool for students in the
Materials and Mechanics Laboratory course at
Texas
Tech
University
. In the web-based experiment, the
students were given an introduction to the concept of hardness, what it means,
how it is measured, and the calibration and utilization procedure using a
Rockwell tester. In three semesters,
three sections of the class were exposed to lecture but not to the virtual
experiment and three sections (three groups) were exposed to both lecture and
the virtual experience. Each group
was given a pre-lab quiz to assess their understanding of the concepts and
objectives of the experiment. The
groups exposed to the virtual lab were also given a short quiz on the procedure
of the experiment. The pre-lab
quizzes were graded without prior knowledge of the students’ section or group
affiliation. Grades were compared between groups that were exposed to both the
lecture and the virtual laboratory and those groups who were only exposed to the
lecture. The average grade of the
students in the lecture and virtual laboratory groups was approximately 20 %
higher than the lecture alone group. This difference was statistically
significant (p<0.05) based on a t-test. The
average grade on the knowledge of the procedure prior to actual experiment for
the lecture and software groups was 75 on a 100 basis.
Also, these students showed a great understanding of the hands-on
procedure without significant input from the instructors.
The lecture only groups did not have a good idea of the procedural steps
and required significant guidance from the instructor. Student evaluations of
the software revealed that students were very enthusiastic about using the
module as a pre-lab preparation tool but not as a replacement to the actual
experiment. In this paper, the
design of the software, important elements of the virtual lab and the evaluation
results will be presented.
Introduction
With the advances
in digital computing and growing interest in distance learning and education,
the role, impact, and delivery approach of laboratory experiences in
undergraduate engineering education are being reexamined [1].
Although the new ABET criteria, EC 2000, does not explicitly require
laboratory instruction, it does require that i) graduating engineers develop an
ability to design and conduct experiments, as well as to analyze and interpret
data (Criterion 3, requirement “b”), and ii) an ability to use the
techniques, skills, and modern engineering tools, necessary for engineering
practice (criterion 3, requirement “k”).
EC 2000 also makes it clear that institutional support must be committed
for facilities and upgrading. Thus,
the importance of the laboratory experience to the education of engineers is
maintained.
There are, however, issues relating to the university, the faculty
members, and the students that hinder the quality of laboratory instruction in
many universities. For instance, the
expense associated with maintaining an updated laboratory experience and modern
equipment is outside the budgetary capabilities of many universities.
Also, the focus of the universities on research and requirements for
tenure and promotion does not allow the faculty members devote and dedicate the
time that is needed to produce quality laboratory experiences for the students.
From the student’s point of view, their lack of familiarity with the
specific equipment and procedures used in the experiments, limited contact time
with the teacher, and other scheduling problems are issues that result in poor
and frustrating laboratory experiences.
One factor that has been a positive influence on the quality of laboratory
experience in undergraduate engineering education has been the utilization of
software and high power computers and in general technology in the delivery of
such courses. Computers and software are increasingly being used in the
laboratory experience in two distinct ways: 1) computers are used for data
acquisition, control, interpretation of data, and analysis, and 2) software
technology has been used to simulate phenomena that are not easily observed
during physical laboratory experiments. The
impact of computers and simulation has lead to development of new distance
education strategies for undergraduate engineering education.
These strategies have the potential to alleviate, to a degree, the
problems and issues associated with laboratory instruction enumerated in the
previous paragraphs.
The major question in distance education is how does one provide a
laboratory experience at a distance? The
original approach to the solution of this problem was generally through tape
recording and television. But with
the advances in computer technology and internet, the possibility of interactive
and real time interaction of a student with specific software or equipment
became a reality. There exist two
types of approaches that are used in such context. One approach uses remote
access technology. In this type of system, the experiment is ‘really’
carried out but is controlled from a distance using internet with various
hardware-software interactions. Such efforts have been done by Manasseh et al.
[2] to monitor seismic effects in structures. Such approach, while gives
realistic outputs, demands some amount of supervision and is not suitable for
all (especially mechanics related) experiments. Another approach uses
stand-alone virtual environment designed using multimedia softwares.
In this case, the experiments carried out are not real but are simulated
on the computer. While this approach is not very realistic, most of the
experiments can be simulated to some degree virtually. Further, is does not need
any hardware other than a suitable computer.
Recently, there have been numerous efforts in this direction in various
fields of engineering. For example,
Elsherbeni et al. developed one of the early virtual laboratories in microwave
and electronics as purely a visualization tool [3]. Some of the earlier efforts
in the development of such tools in various engineering fields are those by
Chevalier et al. in the mechanics area[4], Monter-Hernandez et al. in power
electronics [5], and Avouris et al. in computer-assisted laboratory courses [6].
Some of the more interactive efforts are those reported by Bhandari and
Shor in the area of Controls [7], Budhu in Soil Mechanics [8], Schmid in
Controls [9], and Gustavsson in Electrical Circuits[10].
More recently, other educators have developed interactive software that
can be offered to the students as laboratory preparation tool to become familiar
with the procedure and equipments. Two
such efforts are in Materials Science[11] and Experimental Methodology [12].
The second question related to distance laboratories is “can the
fundamental objectives of the instructional laboratories be met via software and
computers?” In a colloquy convened in 2002 [13, 14], distinguished engineering
educators developed a list of thirteen objectives to be met by an effective
engineering instructional laboratory. These
objectives include:
1)
instrumentation; application of instruments or software to make
measurements of physical quantities,
2)
models; validating the relationship between measured data and
underlying principles,
3)
experiment; devise an experimental approach that includes
implementing a procedure, and interpreting the data to characterize engineering
materials and systems,
4)
data analysis; collect, analyze, interpret, and form conclusions,
5)
design; design, build, and assemble a system to satisfy specific
requirements,
6)
learn from failure; identify unsuccessful outcomes due to faulty
procedure, equipment, process, etc. and develop or identify the successful
outcome,
7)
creativity; demonstrate independent thought,
8)
psychomotor; demonstrate competence in utilization, selection, and
modification of engineering tools and resources,
9)
safety; consider health, safety, and environmental issues,
10)
communication; oral and written communication using executive
summaries and technical reports,
11)
teamwork; work effectively in a team,
12)
ethics; report information with integrity, and
13)
sensory awareness; make sound engineering judgments.
In this paper, our efforts in designing a web-based preparatory software
tool for an experiment on determination of the hardness of a material are
presented. The major goal is to
determine which of the objectives listed by the colloquy may be achieved by our
approach and which objectives need more attention and future research.
The software was designed based on our experience with a previous module
on Metallography (Hashemi et al, 2005) that is well received by the students at
Texas
Tech
University
. The second goal of this paper is
on determining and evaluating the impact of the software on procedure knowledge
and equipment usage familiarity of the students.
Finally, evaluate the feasibility and effectiveness of the virtual
approach in distance education.
The Experiment
The
software was developed for the Materials and Mechanics Laboratory course ME-3328
offered as part of the Mechanical Engineering curriculum at
Texas
Tech
University
. Every
semester, three sections of this course are offered with a maximum enrollment of
sixteen students (four groups) per section.
The students in each section are divided to four groups that will perform
the experiments one group at a time. One
experiment that is performed in this laboratory course is the Hardness
Experiment. In this experiment, the
students will use a Rockwell Hardness tester to determine the hardness of
various known metals. The equipment
requires calibration prior to each test in a given scale.
Under normal circumstances, in addition to the lecture material, the
students are given a twenty-minute lecture during the laboratory period on the
nature of the equipment, its various components, and procedure.
The instructor then performs the first calibration process and allows the
students to perform the hardness experiments.
The process is repeated for every group.
It is clear that a majority of the period is therefore devoted to the
lecture process and there is not a significant amount of time for the students
to perform other more meaningful tasks such as measuring the hardness in various
scales and comparing the relative measures of various scales.
The Web-Based Module
The authors developed an
interactive tool for the students to become familiar with the objectives,
procedure, and equipment used in this experiment.
The virtual experiment was designed using the Macromedia Flash
(Macromedia Inc, CA,
USA
) software. Video clips, images, and
text materials were used in an effective manner to explain each step in the
experiment. The module starts by
introducing the basic definition of hardness (Figure 1), its relevance to
materials selection and design, and its usage and application.
The students step into the module by clicking on the forward arrow button
after they have digested the information on the screen.
The rewind button can be used to step back in the software and refresh
one’s memory of the contents of previous steps.
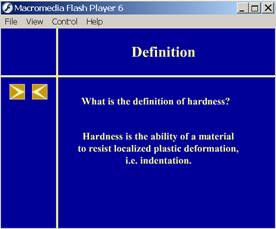
Figure 1. Introductory
stages of the experiment.
(Click on the figure to open the module)
Various hardness tests and scales are then introduced and important
concepts are conveyed. For example,
when discussing the Rockwell hardness tester, the image of the tester is
presented and various important components of the tester are identified.
This gives the student an idea of what the equipment is and what are its
important components and their proper names, Figure 2. Various Rockwell scales
are then presented noting the differences between scales.
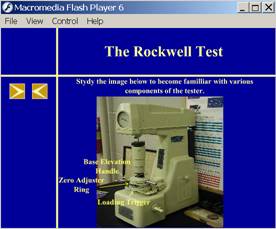
Figure 2. The Rockwell hardness
tester, its components and various scales identifying the type of indenter and
the amount of load needed.
(Click on the figure to open the module)
Once the
introductory stage is completed, the calibration process is presented.
The students are shown that for each scale, the tester must be calibrated
using a calibration block of known hardness.
The calibration process is then presented in a step-by-step manner using
single and multiply synchronized video clips.
The steps including selection and insertion of the proper indenter and
proper load, Figure 3, are presented with video clips.
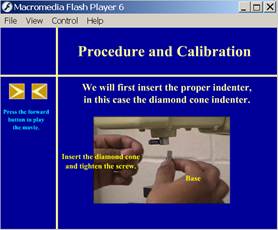
Figure 3.
Preparation of the tester for the scale of choice: Indenter insertion and
load placement.
(Click
on the figure to open the module)
Various
steps are then presented through use of synchronized video clips.
For example, when the ring is used to initialize the analog pointer the
movement of the pointer is shown on a side by side video clip, Figure 4.
This allows the student to understand the process better.
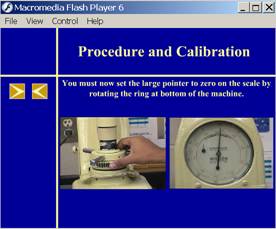
Figure 4. Initializing analog pointer
A
similar process is used to show the final steps of the process, which includes
the application of the minor load, trigger of the major load and the effect on
the position of the pointer, Figure 5.
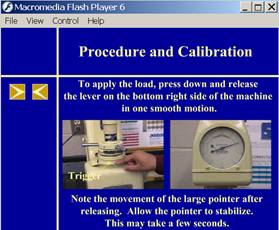
Figure
5. The trigger mechanism for loading and the pointer movement.
(Click on the figure to open the module)
The impact of each step of loading (minor load, major load, and removal of
major load) and the resulting indentation levels are also presented to relate
the theory behind the development of the apparatus and the results, Figure 6.
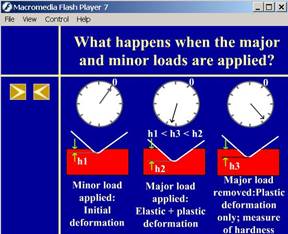
Figure 6. The
resulting indentations after application of various loads explaining the theory
behind the design of the machine.
Finally, the reading of the hardness value is presented using an image
that compares the dial value with the actual hardness value of the calibration
block, Figure 7.
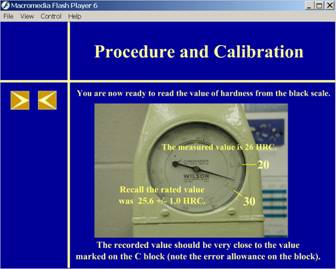
Figure 7.
The final position of the pointer showing the measured value and its
comparison with the actual value.
The system is now calibrated and ready for use.
The actual measurement process is identical to the calibration process.
The students will be then asked to recall the order of some of the major
steps involved in the procedure of calibration, Figure 8.
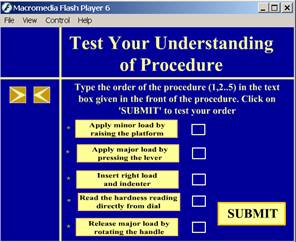
Figure
8. Identify the order of the procedure in a correct manner.
(Click on the figure to open the module)
They
are also educated about some major facts about the Rockwell hardness testing
experiment such as its advantages and disadvantages. Only after the students are
able to identify the procedure in correct order they are allowed to proceed to
next stage i.e. virtual performance of the experiment.
In the next section, the students will be given the ability to measure the
hardness of a metal sample by selecting the proper scale, indenter, and load.
There are many options but only one is the correct one, Figure 9.
An iteration process will take place to finally determine the correct
answer; unless they choose the right indenter-load pair for the selected scale,
they are not allowed to proceed. Therefore, the students learn from both correct
and incorrect decisions. Upon the
proper selection of the scale and the corresponding load and indenter, they
proceed by applying the major load and releasing it by pressing various buttons
designed for those purposes. The corresponding response of the pointer is
presented to the students. Based on
number of rotations of the pointer, when major load is applied, the students
will have to decide if the chosen scale is the right scale or not, Figure 9. If
the chosen scale is not appropriate (too hard or too soft), they can revert,
chose a different scale, and repeat the whole process. We call this feature of
the virtual lab the “decision tree” which allows for the students to make a
mistake or choose the wrong path, observe the result of their decisions, and
make appropriate adjustments to come up with the proper answer.
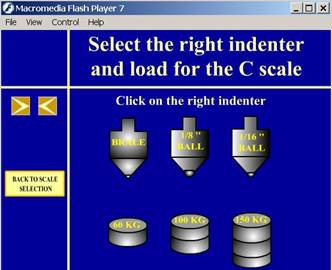
Figure 9.
The students will choose the proper combination of indenters and loads
for their scale of choice.
(Click on the figure to open the module)
Software Evaluation
The students in
the Materials and Mechanics Laboratory course at
Texas
Tech
University
evaluated this virtual laboratory software over a period of three semesters.
During Fall semester of 2003, while all sections were given an in-class
lecture about hardness measurement, one section of the laboratory was given the
ability to view the software through the Internet. The module was placed in the
department web server and students were given access to the module for 10 days.
The access to the software was password protected and the password was
the social security number of the student which is less likely to be shared than
any other password. There was no
limit to the number of times a student could view the software.
The students in all sections were given a pre-lab quiz regarding the
objectives and important issues of the experiment. The quizzes were graded
without any knowledge of the affiliation of the student to a given section.
After grading and identifying the affiliation of the students with their
sections, the average grade of the students in the lecture and virtual
laboratory groups was found to be approximately 20 % higher than the lecture
alone groups (with a p-value of 0.007 based on a t-test).
The p-value of .007 indicates that the difference between the
performances of the two groups is real and is not due to chance.
If the calculated p-value were greater than .05 that would indicate that
the difference is not statistically significant.
The average grade on the knowledge of the procedure prior to actual
experiment for the lecture and software group was 75 on a 100 basis.
Also, the students exposed to both lecture and software showed a great
understanding of the hands-on procedure without significant input from the
instructors. This allowed for a much
more effective experimentation process. The
lecture only groups did not have a good idea of the procedural steps and
required significant guidance from the instructor.
During the Spring
semester of 2004, one section was exposed only to web-based module while the
other two sections were exposed to in-class lecture only. This time, the quiz
scores were not statistically different (p=0.5).
This shows that the software is as good as in-class lecture as far as
understanding the concepts of hardness is concerned.
However, this comparison and the one mentioned in the previous paragraph
indicate that the best approach to achieve learning is through exposure to both
lecture and software. It should also be noted that the software-only group was
found to have a greater understanding about the procedure of the experiment and
were able to perform the experiment independently unlike the lecture-only
groups. Thus, as far as the understanding of the procedural aspects of the
experiment is concerned, the web-based module was found to be more effective
than in-class lecture.
During the Fall
semester of 2004, the same experiment as in Fall 2003 was repeated but this time
two sections were given access to the virtual lab software along with in-class
lecture while one section had access only to the in-class lecture. The results
were similar with students exposed to both virtual lab software and in-class
lecture performing better in quiz and in the laboratory.
During the last
evaluation period, the students who were exposed to the web-based module were
also asked to fill out an evaluation questionnaire form anonymously (see
Appendix 1). Students were asked to rate, on a scale of 1-9
(1 indicating the most negative response and 9 indicating the most
positive response to the question), the usefulness, relevance, structure,
detail, interactivity, involvement, and effectiveness of the software.
The average scores of the evaluation are given in Figure 10.

Figure 10. Results of student evaluation questionnaire.
The bar graph
clearly shows that the students found the web-based module very effective in
understanding the objectives, following procedure, and performing the actual
experiment. In the design of the questionnaire we tried to measure the accuracy
of the students responses by asking redundant questions.
For example questions 1 and 2 both relate to the effectiveness of the
software in relaying the objectives of the experiment and both questions
elicited a positive response (above 7 rating).
Question 3, 4, and 7 relate the organization of the software and again
both elicited a positive response. Questions
5 and 6 relate to the amount of information provide by the software.
Note that question 5 is posed in a positive manner (rate the degree of
detail) and the response is very positive (above 7).
On the contrary, question 6 poses the same question in a negative manner
(i.e. both extremes of 1- overwhelming amount of information and 9- not enough
information are negative). Note that
the response is then slightly above 5 indicating a reasonable amount of
information. This is important in
software design because students are found to lose interest if too much
information is provided simultaneously. Questions
9 and 17 relate to the effectiveness of the decision-tree feature of the module
and the response was again positive (above 7).
Question 10, 11, and 12 collectively relate to the level of interactivity
of the software. The students found
the software to be very interactive (above 7); they believed they were involved
in the learning process (above 7), and found the mini quizzes (the questions
about procedure and decision tree structure) effective (above 6.5).
Questions 13 through 16 relate to the effectiveness of the module in
preparation of the students for the actual experiment.
The student response shows that the module was very effective and
prepared them for the experiment well (above 8 – Q16 above 7).
When asked about the overall effectiveness of the module, question 18,
the response was excellent (above 8). When
asked if they believe having a similar module for every experiment was a good
idea, the response was the strongest (above 8.2).
Finally when asked about replacing the actual experiment with a virtual
module, the response was very negative (above 4).
The students appreciate and enjoy the hands-on aspect of laboratory
courses and do not want to see it replaced by software.
Conclusion
Our
results show that web-based experiments that are designed to be interactive and
allow the user to be involved in the learning process are effective for distance
education. They allow for learning
of objectives and learning the procedure and analysis of data.
In situation where physical laboratory facilities are not available,
virtual modules are a suitable replacement.
The authors believe that objectives 1, 2, 3, 4, 6, and 8 have either been
addressed or can easily be addressed with some adjustments.
Objectives 5, 9, and 10 can be achieved with more intensive programming.
Objective 7, and 11 through 13 may be discussed
in the software but are harder to implement.
Interactive software is an excellent tool to prepare the students of
laboratory courses for the actual experimentation period. Our results show that
the students can learn the objectives and the procedure of the experiment in a
more meaningful manner when exposed to such software. The software can be
accessed by the student at their convenience and can be viewed as many times as
the student requires.
Acknowledgement
The support of
Teaching, Learning, and Technology Center (TLTC) is gratefully acknowledged.
Also, two of the authors (JH and EEA) gratefully acknowledge the partial support by the National Science Foundation's Course, Curriculum, and
Laboratory Improvement Program under grant DUE-0231406.
Thanks are also due to A.
Deshpande, for assisting with the video content and experiment design.
References
1.
L.D. Feisel, and A.J. Rosa, The role of laboratory in undergraduate
engineering education. J. Eng. Educ. 94, 121-130 (2005).
2. M. Manasseh, E.
Kausel, K. Amaratunga, A web-accessible shaking table experiment for the remote
monitoring of seismic effects in structures.
Proc.
ASEE
Conf.
Salt
Lake
City, UT, 15339-15351 (2004).
3. A. Elsherbeni, M. Tew,
and A. Mokaddam, Applying Multimedia Technology To Undergraduate Engineering
Laboratories. Comput. Appl.
Eng.
Educ. 3, 157-164 (1995).
4. L.R. Chevalier,
J.N. Craddock, P.C. Riley, and B.J. Trunk, Interactive multimedia labware for
strength of materials laboratory. Comput.
Appl.
Eng.
Educ. 8, 31-37 (2000).
5.
O. Montero-Hernandez, A. Rugerio
De La Rosa, D. Baez-Lopez, and R. Alejos,
E. Enriquez
, Power lab: a tool to learn electrical machines and power electronics. Comput.
Appl.
Eng.
Educ. 7, 213-220, (1999).
6. N.M. Avouris,
N. Tselios, and E.C. Tatakis, Development and evaluation of a computer-based
laboratory teaching tool. Comput. Appl.
Eng.
Educ., 9, 8-19 (2001).
7. A. Bhandari,
and M. Shor, Access to an instructional control laboratory experiment through
the world wide web. Proc. American
Control. Conf.
Philedelphia
,
PA
, (1998).
8. M. Budhu,
Enhancing instructions using interactive multimedia simulations.
Simulation, 76, 222-231 (2001).
9. C. Schmid,
A remote laboratory using virtual reality on the web.
Simulation 73, 13-21 (1999).
10.
I.
Gustavsson, User defined electrical experiments in a remote laboratory. Proc
ASEE conf.,
Nashville
, TN. (2003).
11. J.
Hashemi, K. Austin, A. Majkowski, E.E. Anderson, and N. Chandrashekar, Elements
of a realistic
virtual laboratory experience
in materials science: development and evaluation. Int. J. Eng. Educ., 21,
(2005) (on-line interactive
version available at www.ijee.dit.ie).
12. K. Swanson
and D. Lynch,
WebLab: a new approach to undergraduate ME laboratory training at Georgia
Tech. Proc. ASEE conf.,
Nashville
TN. (2003).
13.
L. Feisel,
and G.D. Peterson, A colloquy
on learning objectives for engineering educatinal laboratories,
Proc. ASEE Conf. Montreal, Ontario, Canada, (2002).
14. G.D. Peterson,
and L. Feisel, E-Learning: the challenge for engineering education.
e-Technologies in Engineering Education, A United Engineering Foundation
Conference,
Davos
,
Switzerland
, (2002).
Author
Bibilographical Sketch:
Javad Hashemi is a professor in the mechanical engineering department
at
Texas
Tech
University
. He received his PhD in Mechanical Engineering from
Drexel
University
in 1988. He taught and developed graduate and undergraduate courses in
Mechanics and Materials areas. He
has also developed the Mechanics of Materials laboratory Course at
Texas
Tech
University
.
Naveen
Chandrashekar is a doctoral candidate in the Mechanical Engineering
department of
Texas
Tech
University
. He received his master’s degree in Mechanical Engineering from
Texas
Tech
University
in 2003. He is also the laboratory
instructor for Mechanics and Materials Laboratory.
Edward E Anderson is a
professor in Mechanical Engineering department of
Texas
Tech
University
. He is also the director of
Teaching Learning and Technology Center (TLTC) at
Texas
Tech
University
.
Appendix:
Virtual
Lab Evaluation Questionnaire
Questions (Rate from a
scale of 1 to 9, 1 represents a very negative view and 9 a very positive view):
1-
Is the module effective in expressing the objectives of the experiment?
2- Is the module effective
in expressing why this experiment or knowledge gained from it is relevant and
important?
3- Is the structure of the
module from a hierarchy of information point of view acceptable?
4- How would you rate the
organization and structure of presentation in the module?
5-
How would you rate the “degree of detail” in the presentation of the
concepts?
6-
How would you rate the amount of information presented in the module?
i.e.
too much information “1-overwhelming” or not enough information “9-
uninformative”.
7-
How would you rate the ease of navigation in the software?
8- How would you rate the
use of video clips and images in the module?
i.e.
Video clips and imagery did not help “1- useless” or they helped clarify
steps
and issues “9- helpful”.
9- In the virtual lab on
hardness, you were asked to choose a scale for measurement of hardness of a
given metal. Some of the scale
options that were provided were unacceptable.
The module presented you with what happens if you pick a wrong scale.
How do you rate this feature of the module?
10- How would you rate the interactivity of the model?
11- Did you feel that you
were involved in the learning process?
12- How do you rate the
mini quizzes or questions that you encountered in the module?
13-
Having viewed and tested the module before actually performing the experiment,
how do you rate your “overall preparedness” for the actual experiment on the
day of experiment?
14- How do you rate your
knowledge of “objectives” for the actual experiment on the day of
experiment?
15-
How do you rate your knowledge of “procedure” for the actual experiment on
the day of experiment?
16- How do you rate your
knowledge of “what to expect in terms of results” for the actual experiment
on the day of experiment?
17- How do you rate your
the ability to make decisions and observe the results of your decision (even if
you made an incorrect decision)?
18- How would you rate the
overall effectiveness of the module?
19- In your opinion, will
having a virtual module for every experiment in our ME3328 laboratory be helpful
in preparing for the actual experiment?
20-
If the department were not offering a materials laboratory course, would these
virtual experiments be an acceptable replacement experience?
21- How do you rate your
interest in using this software or any other software for other courses or
textbooks? i.e. what is your
position about use of software as a supplement with your courses?
(“1- not enthusiastic at all” and “9-very enthusiastic”)